I just wanted to implement a histogram
So for the Darkslide - keyboard-driven photo editor I am building I want to properly create Image Histogram.
I wanted at first to implement luminance histogram to see how the brightness is distributed across image. And in ITU-R BT.709 standard (standard for modern screens) there is a way to calculate luminance value:
Y = 0.2126·R + 0.7152·G + 0.0722·BBut before we go further - what is luminance? Luminance is just brightness. It takes a colour of a pixel and turns it into a single number that says how light or dark that colour looks to your eyes.
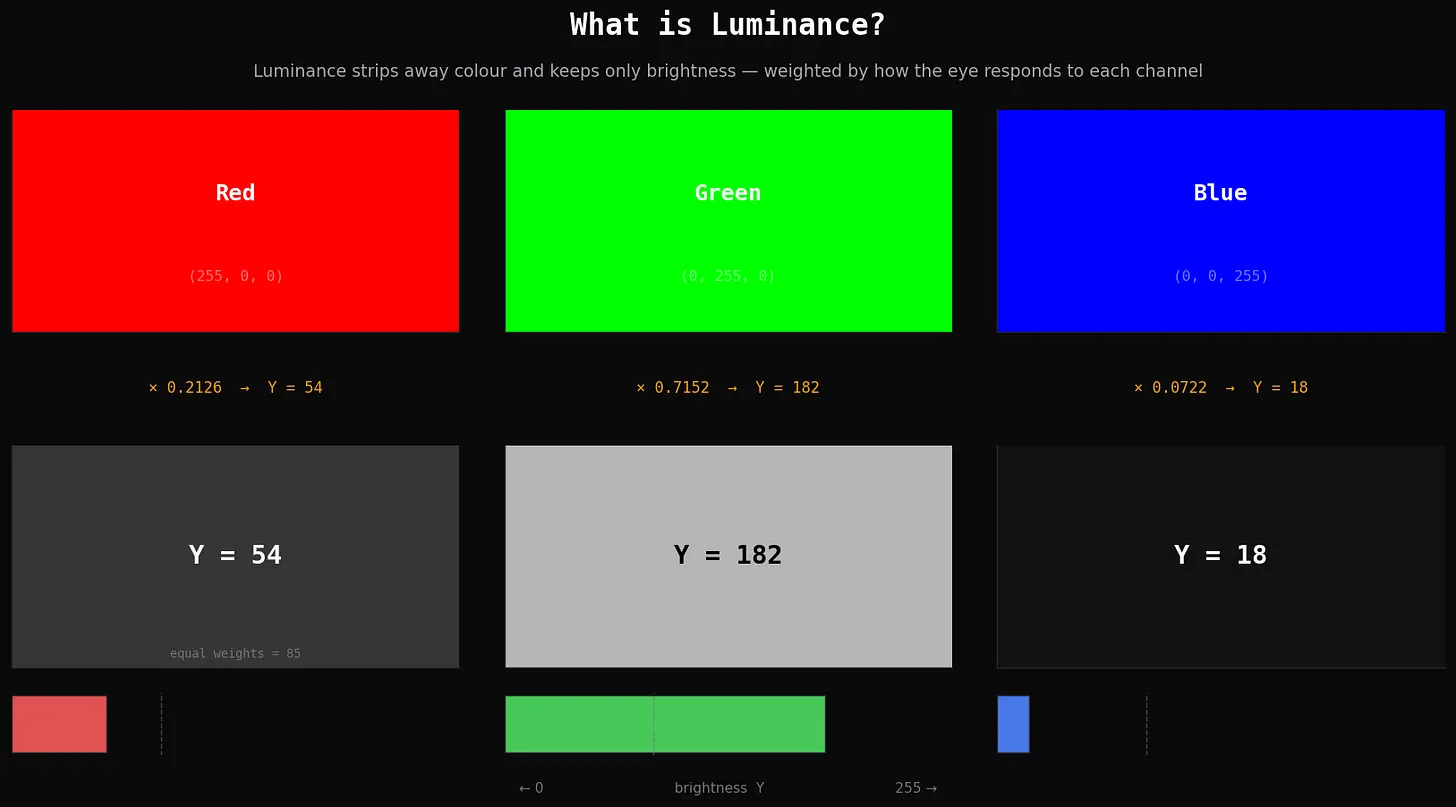
The interesting part: the three primary colours (Red, Green and Blue -> RGB) are not equally bright. Pure red, pure green, and pure blue all use the same amount of colour (255), but the eye sees them very differently. Green looks the brightest, red is in the middle, and blue is almost dark.
That is why each colour gets its own weight in the formula to calculate that luminance value is. Green is multiplied by the biggest number (0.7152) and blue by the smallest (0.0722). Multiply each colour by its weight and you get its brightness value Y.
But, why not just to average RGB values to get the gray colour?
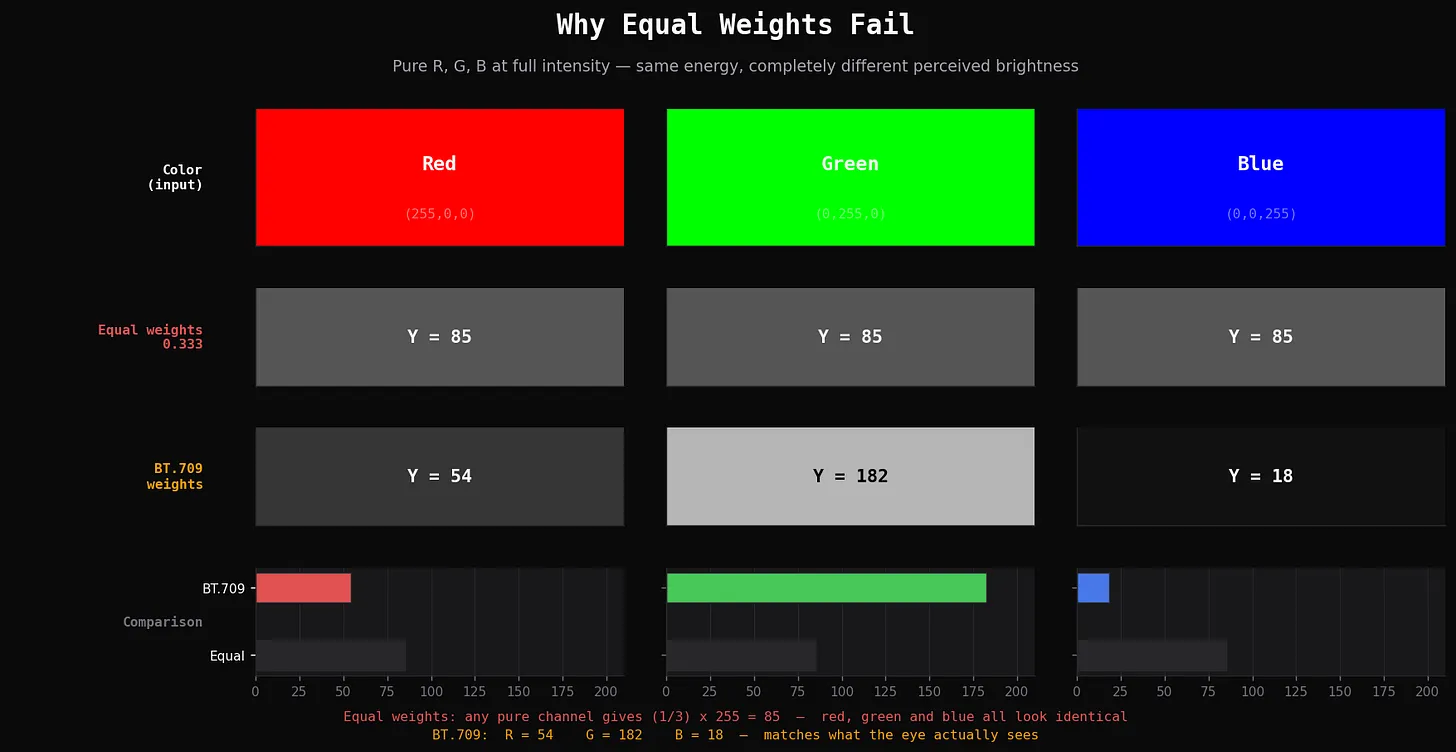
With equal weights, any single pure colour gives the same result: one-third of 255, which is 85. So pure red, pure green, and pure blue would all turn into the exact same gray. That does not match what you see at all — green looks brighter for a human eye than blue.
The main reason why the formula was created in a first place is simple: backward compatibility between black-and-white TV and colour TV.
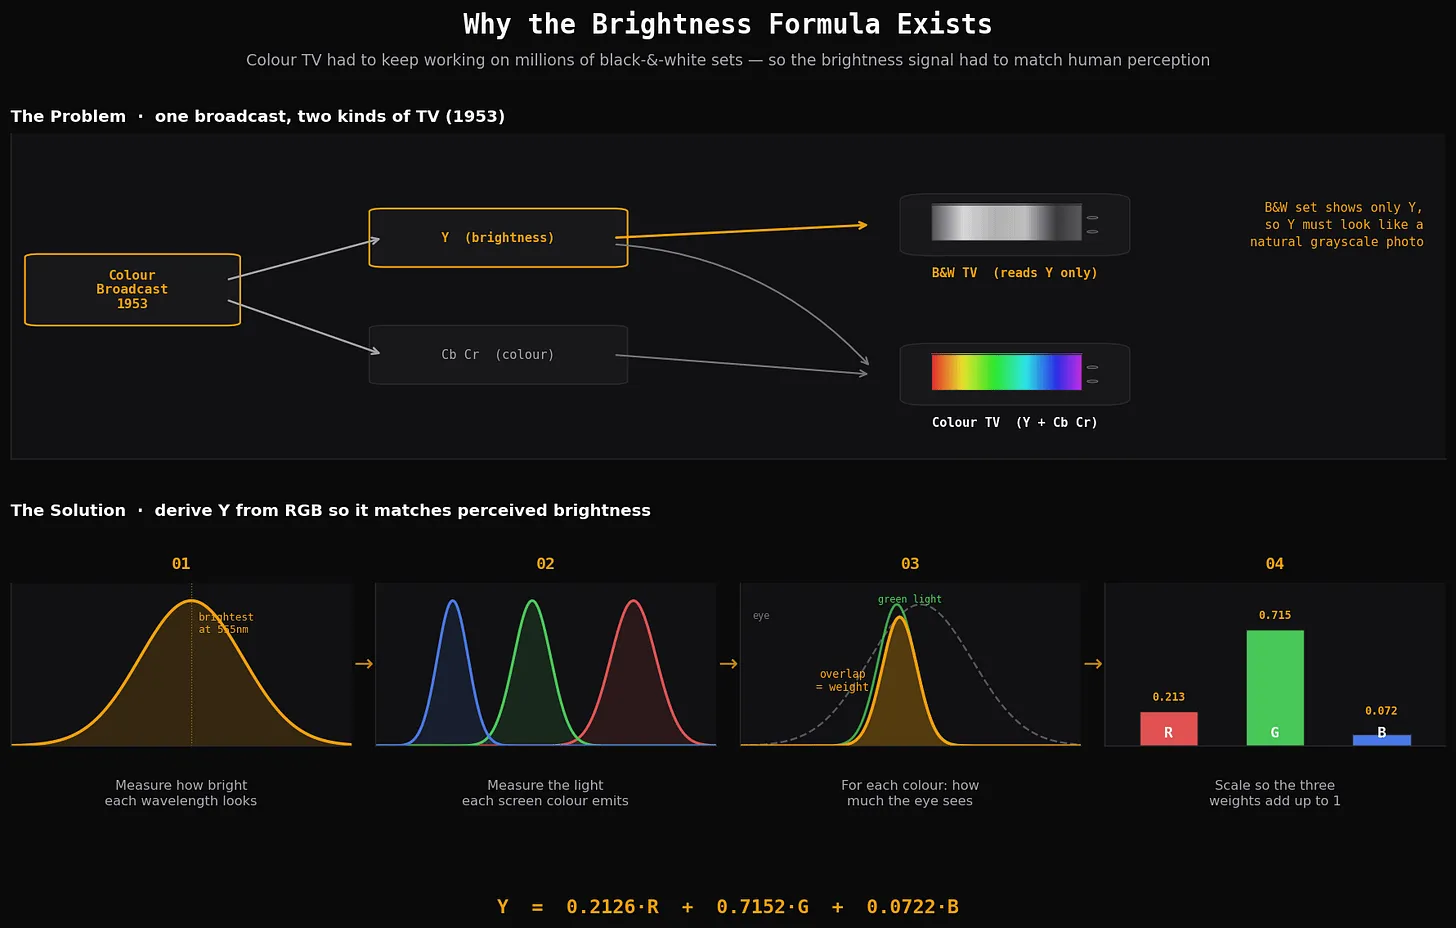
When colour TV was created in 1953, lots of homes already had black-and-white sets. But, the broadcast should be the same for both versions. The solution was to split the signal into two parts: a brightness signal (called Y aka luminance) and a separate colour signal (called Cb and Cr). Colour TVs used both colour signals. Black-and-white TVs ignored the colour part and showed only Y, which resulted into a correct black-and-white image for a human eye. Because the old sets displayed Y directly, Y had to look like a normal, natural grayscale picture.
The solution (bottom row). To build that brightness value, engineers worked
through four steps:
-
Measure how bright each wavelength looks to the human eye.
-
Measure the light each screen colour emits (red, green, blue phosphors).
-
For each colour, combine the two — where the eye’s sensitivity and the colour’s
light overlap, that overlap tells you how much brightness that colour adds. -
Scale the three results so they add up to 1.
The final numbers are the coefficients in the formula:
Y = 0.2126·R + 0.7152·G + 0.0722·B 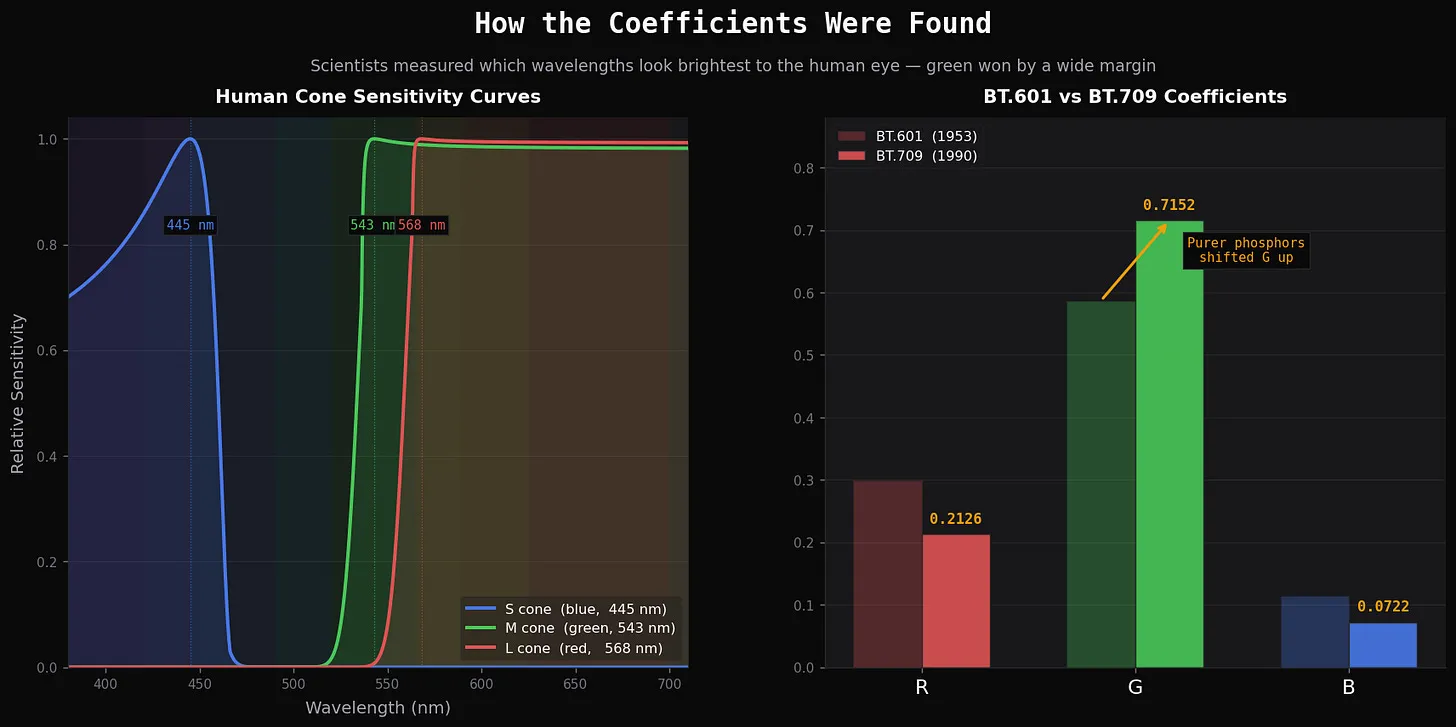
Interestingly, there are 2 standards for the same formula: BT.601 (from 1953) and the newer one BT.709 (from 1990). Also, if you worked with video editors you saw Rec709 - it is just a different name for BT.709 and it will use the same formula to extract luminance.
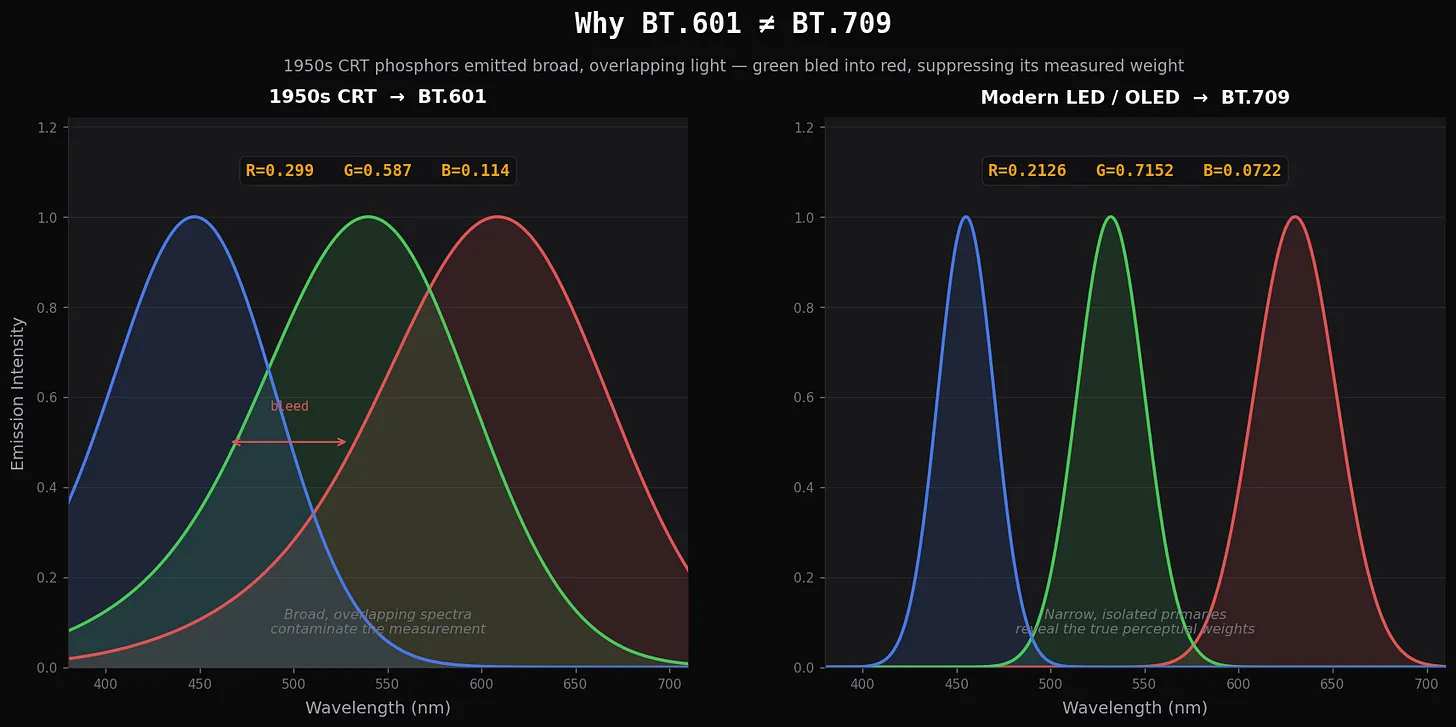
The reason is the screen hardware. Old TV screens made colour using phosphors that glowed in broad, messy bands of light. The green and red light overlapped, which blurred the measurement and made green look weaker than it really is. Sometimes was not clear if that luminance contribution came from red channel or green.
Modern screens produce much cleaner, sharper colours. With pure colours, the measurement showed green’s real contribution, so its weight increased.
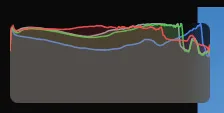
From the Darkslide there are some examples you could see for histogram with luminance only:
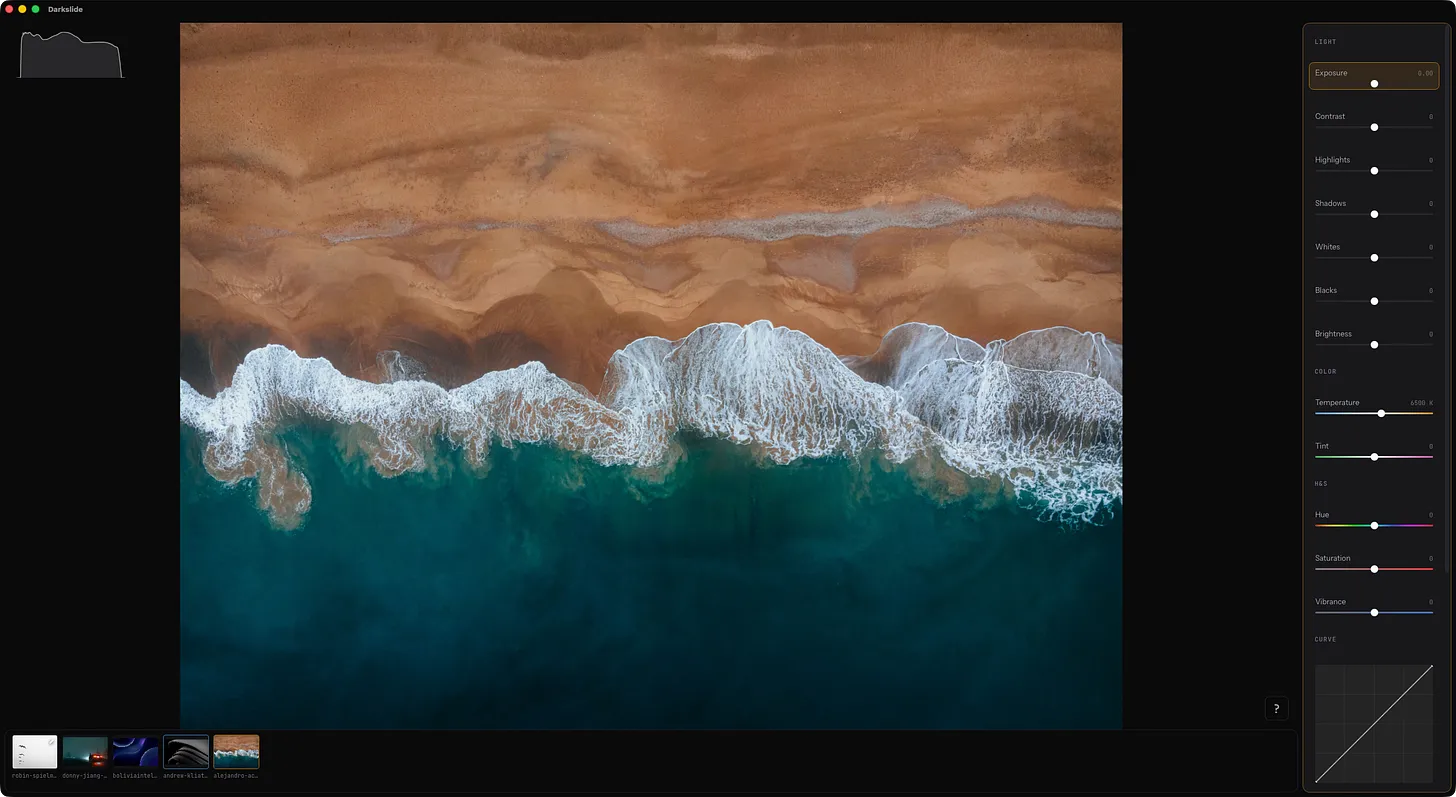
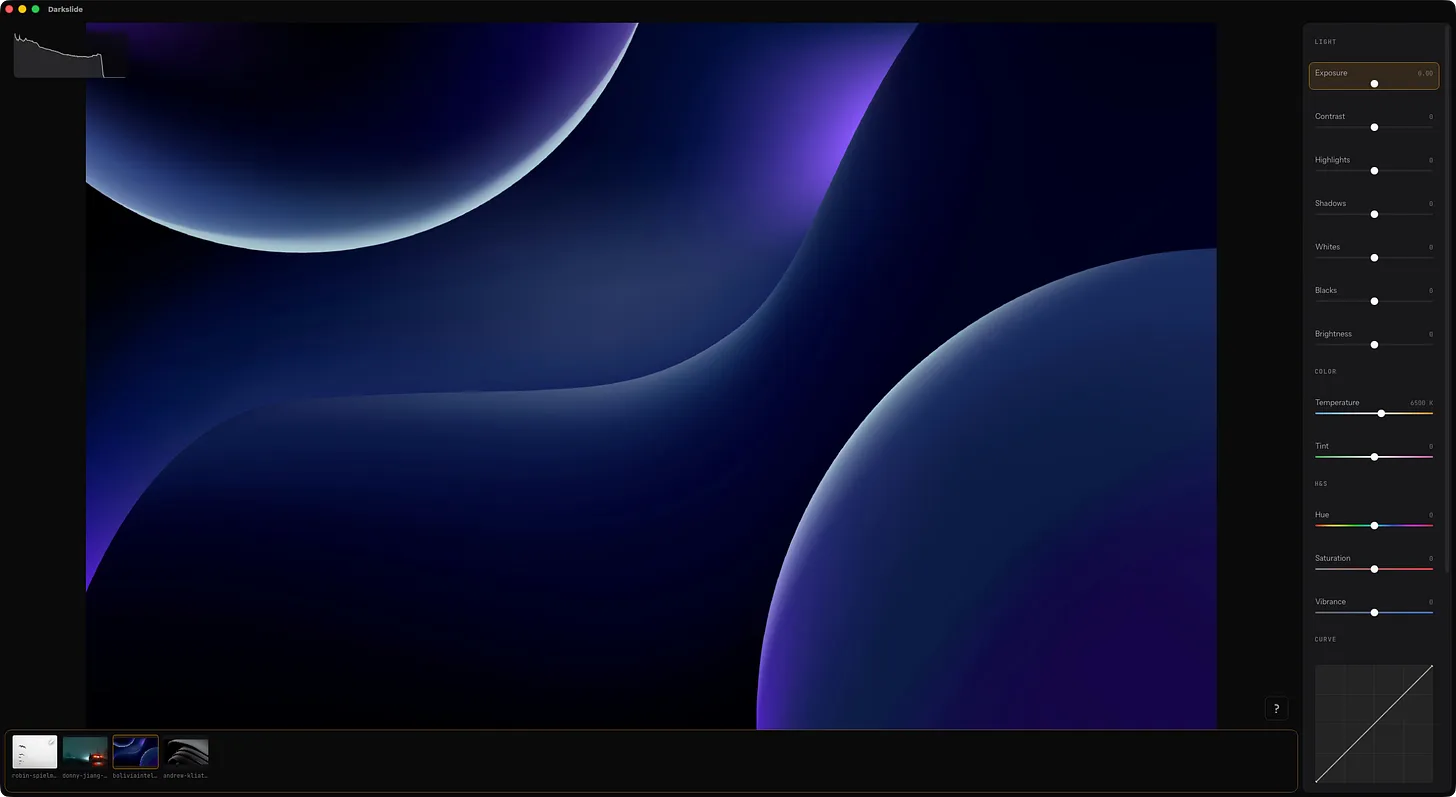
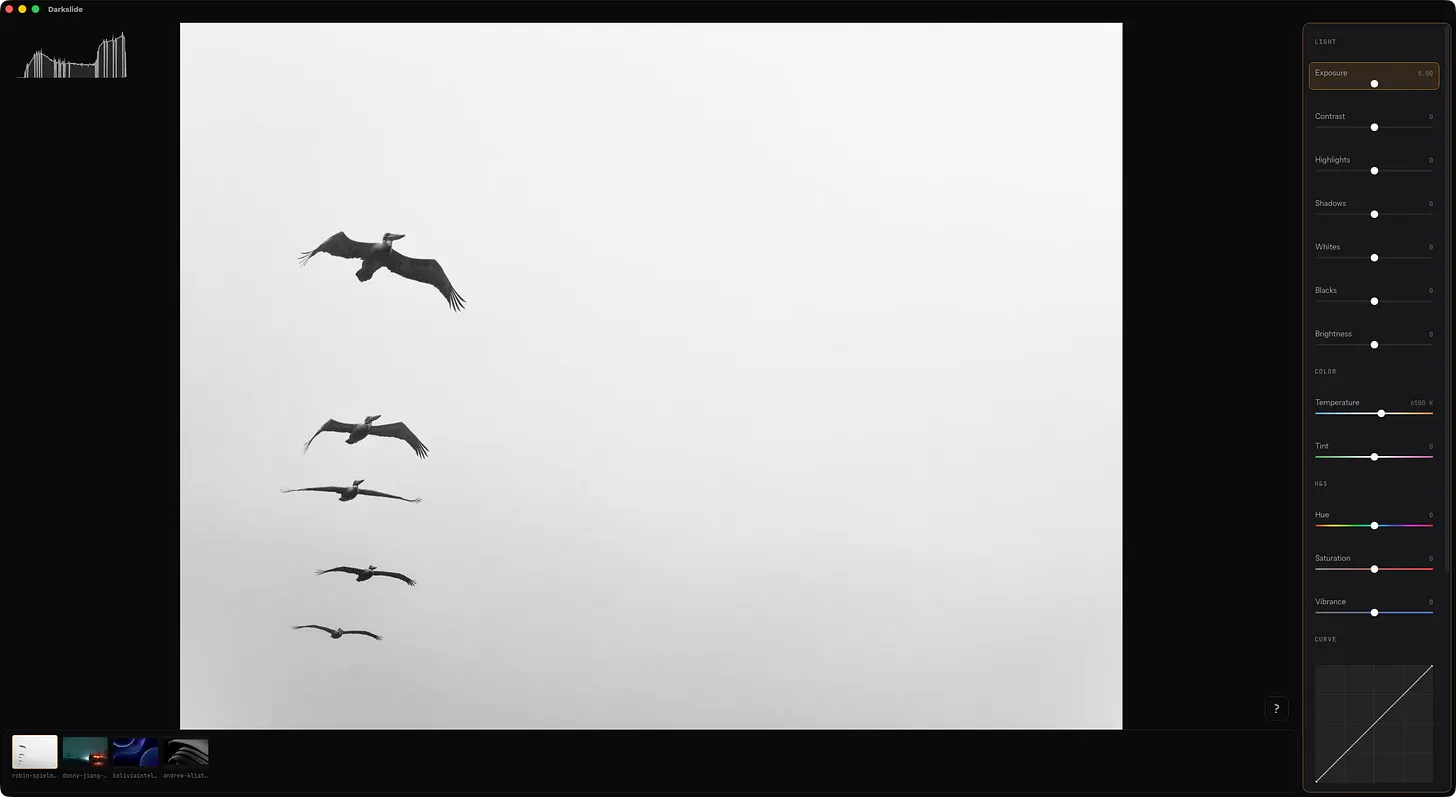
Since Darkslide core is built with Rust - let’s see how it luminance calculation could look like in the code. This code calculates histogram for Y, but also for RGB channels. So the function’s output is an array that contains 4 histograms sequentially.
[R, R, R, R, ......, G, G, G, G, ........, B, B, B, B, ......., Y, Y, Y, Y,........]#[inline]
fn luma_u8(r: u8, g: u8, b: u8) -> u8 {
const LUMA_R: f32 = 0.2126;
const LUMA_G: f32 = 0.7152;
const LUMA_B: f32 = 0.0722;
(LUMA_R * r as f32 + LUMA_G * g as f32 + LUMA_B * b as f32) as u8
}
// expect RGBA format
pub fn calculate_histogram(pixels: &[u8]) -> Box<[u32; 256 * 4]> {
const R: usize = 0;
const G: usize = 1;
const B: usize = 2;
const L: usize = 3;
// rgba
assert!(pixels.len() % 4 == 0);
// split into chunks by 4 - one rgba pixel
pixels.par_chunks(4)
.fold(|| Box::new([0u32; 256 * 4]), |mut hist, pixel| {
let (r, g, b) = (pixel[0] as usize, pixel[1] as usize, pixel[2] as usize);
let l = luma_u8(pixel[0], pixel[1], pixel[2]) as usize;
hist[r + R * 256] += 1; // R: indices 0..255
hist[g + G * 256] += 1; // G: indices 256..511
hist[b + B * 256] += 1; // B: indices 512..767
hist[l + L * 256] += 1; // L: indices 768..1023
hist
})
.reduce( || Box::new([0u32; 256 * 4]),
|mut a, b| {
for i in 0..256 * 4 { a[i] += b[i]; }
a
})
}If we avoid some code to send the data between Tauri layer and Frontend - here is just a simple way to draw a histogram:
export const HistogramView = memo(({ histogram, className }: {
    histogram: Histogram | null;
    className?: string;
}) => {
    const canvasRef = useRef<HTMLCanvasElement>(null);

    useEffect(() => {
        const canvas = canvasRef.current;
        if (!histogram || !canvas) return;
        const ctx = canvas.getContext("2d");
        if (!ctx) return;

        const W = canvas.width;
        const H = canvas.height;


        const r = new Float32Array(histogram.red);
        const g = new Float32Array(histogram.green);
        const b = new Float32Array(histogram.blue);
        const luma = new Float32Array(histogram.luma);

        ctx.clearRect(0, 0, W, H);
        drawCurve(ctx, luma, W, H, "rgba(210,210,210,0.15)", "rgba(210,210,210,0.7)");
        drawCurve(ctx, b, W, H, "rgba(80,140,255,0.15)", "rgba(80,140,255,0.9)");
        drawCurve(ctx, g, W, H, "rgba(80,210,80,0.15)", "rgba(80,210,80,0.9)");
        drawCurve(ctx, r, W, H, "rgba(255,80,80,0.15)", "rgba(255,80,80,0.9)");
    }, [histogram]);

    return <canvas ref={canvasRef} width={200} height={80} className={className} />;
});
There is a history behind just 3 coefficients in a formula to get from RGB into YCbCr, so in the past people could watch great old-school back-and-white TV.
But, for example, for multimedia apps like Darkslide that Y formula gives ability to draw a histogram of luminance distribution for an image, which helps to understand better if an images is overexposed, underexposed or what is the distribution of the light among an image.
Also, YCbCr is used more often. E.g., JPEG format is based on it, lots of popular video codecs like H.264/AVC, H.265/HEVC. Whole video streaming uses YCbCr as it helps reduce amount of transmitted data a lot.
Cool to see how a backward compatibility issue years ago still gives progress in technology.
$ echo "test"
✓ Thank you! You are subscribed.